ReportedIP Linux Agent 0.3.48: Monitoring, Rule Control and Fewer False Bans
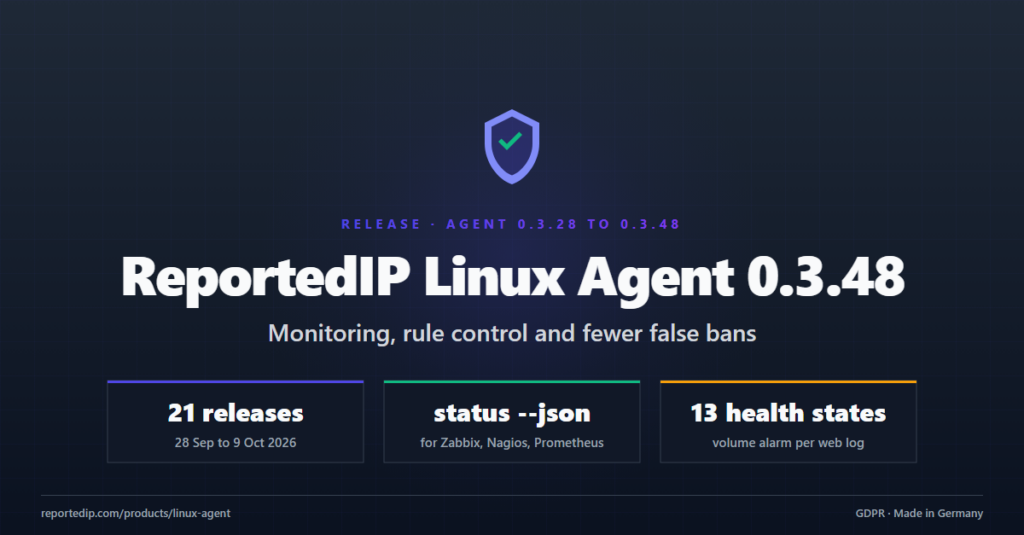
ReportedIP Linux Agent 0.3.48 gives monitoring systems a JSON health check, lets operators set a ban time per rule, simulate a rule and drop known-good log lines, and stops banning FTP customers, WordPress admins and filtering mail relays. It closes 21 releases shipped between 28 September and 9 October 2026, most of them driven by measurements on the hosts that already run the agent.
A host with automatic updates on picks up 0.3.48 at its next update check, which the sync run makes every six hours. Everything else about the agent is on the Linux Agent product page and in the agent documentation.
What changed between Linux Agent 0.3.27 and 0.3.48?
| Area | Releases | Main change |
|---|---|---|
| Monitoring | 0.3.31, 0.3.32, 0.3.40 | status --json, daemon heartbeat, no false alarm on hosts without a group |
| Rule control | 0.3.43, 0.3.45 | Ban time per rule, simulation, ignore patterns, operator rules first |
| Bot floods | 0.3.44, 0.3.46 | Volume alarm per web log, shipped crawl rule in simulation |
| Fewer false bans | 0.3.39, 0.3.42, 0.3.47, 0.3.48 | FTP passive mode, refused page assets, WordPress admin-ajax, filtering mail relays |
| Install and diagnostics | 0.3.29, 0.3.30, 0.3.34 to 0.3.38, 0.3.41 | Web logs read from the server config, log levels, doctor finds unwatched services |
The group list and the group whitelist arrived just before this run, in 0.3.24 and 0.3.27; they are covered in Share IP bans across Linux servers.
How do I monitor the Linux Agent with Zabbix, Nagios or Prometheus?
Since 0.3.40, reportedip-agent status --json prints one JSON document with the same verdict and the same exit code as the text output: status is ok, degraded or error, and problems lists every reason behind exit 1. It also carries the numbers worth graphing: list sizes, age of the last sync, active bans, queue length and the state of every log source.
- No API request. The account part is the answer the last sync cached, so a check every few minutes costs nothing.
- A stable contract. The document carries
schema: 1, and fields are only ever added under that number. - A stopped daemon is an error. The watch daemon leaves a heartbeat, and
statusexits 1 when it is missing or older than two minutes. Before, the lists stayed in the kernel and nothing looked wrong while nothing was detected. - No false alarms. A host whose key is in no group is no longer called degraded (0.3.32), and the reputation of the host’s own address only raises a warning from confidence 75, the lowest level any feed serves (0.3.31).
Ready-made setups for Zabbix, Nagios and Icinga, Checkmk and Prometheus are on the monitoring page; the exit codes are listed under operations.
How can I control a single detection rule?
0.3.43 added four controls that used to need a rule override or a config change for the whole host:
| Control | How | What it does |
|---|---|---|
| Ban time per rule | action.time_minutes in a rule file | Sets the first ban of that rule, from one minute to a year |
| Simulation | reportedip-agent rules simulate <id> | The rule keeps detecting and reporting, the ban becomes a simulated ban warning in the journal |
| Ignore patterns | /etc/reportedip-agent/ignore.d/<source>.conf | Drops matching log lines before any detector sees them |
| Ban export | ban list --json or --plain | Hands the bans to nginx, HAProxy or a script |
Ignore patterns are meant for health checks, monitoring probes and ACME paths. A pattern that would swallow a line the shipped rules are tested to detect is refused, and so is a pattern that matches the empty string. Since 0.3.45 your own rules run before signed packs and shipped rules, so an operator rule can no longer be shadowed by a shipped one. A policy override such as report: false no longer puts a rule under a day of observation (0.3.43).
The rule file format and the rules commands are described on the detection page; ban times, simulation and the export are under blocking.
What does the agent do against bot floods?
Since 0.3.44 the daemon counts every line of every log it reads and keeps a baseline of lines per hour for each web log. When the running hour reads far above that baseline, the health state volume goes to warning, one of 13 health states. The alarm names the loudest site and bans and reports nothing; a flood of crawlers is a capacity question, not community data. It needs 24 full hours of baseline before it can fire, and volume_factor: 0 in config.yaml switches it off.
The same release ships the rule web-query-crawl in simulation. It looks for clients that request many query-string pages without a referer of their own. Since 0.3.46 it only counts clients that pose as a browser, so a crawler that names itself is never banned by it. Before shipping, it was measured on five servers over two days: no visitor and no monitoring crossed it, only crawlers and bots. The guide Bot flood detection and countermeasures shows when to arm it.
Which false bans did the agent stop?
- FTP customers in passive mode (0.3.39). Every passive data connection looked like a probe of a closed port, and one customer on a managed host was banned three times in a day. The port scan rule now asks the kernel whether a socket listens at that moment, and the passive range of pure-ftpd, proftpd and vsftpd is read from their configuration.
- Visitors of a broken page (0.3.42). A refused font, image, style or script, and anything under
/.well-known/, no longer counts as a blocked request. Probes for/.envor/.git/still do. - Logged-in WordPress admins (0.3.47).
admin-ajax.phpanswers 400 for every action without a handler, and a busy dashboard produces that many times an hour. It is no longer counted; every other path under/wp-admin/is. - Filtering mail relays (0.3.48). A rejected envelope sender was counted against the connecting server, which behind a filtering relay is always the relay. One ban stopped incoming mail for twelve hours. Over 20 days of a fleet mail server this changes the verdict for the relay only.
- Whitelisted addresses in
test(0.3.33). The verdict column now says no for an address the whitelist protects.
What is new in install and diagnostics?
- Web logs from the web server’s own configuration (0.3.34).
installreads the vhost files underconf.dandsites-enabled, so per-site access logs of a hosting setup are found, not only the default paths. - Log levels (0.3.29, 0.3.38).
log_leveltakesdebug,info,warnorerror; a fresh install writeswarn.install --log-levelandREPORTEDIP_LOG_LEVELset it during a rollout. - Replacing fail2ban (0.3.30).
REPORTEDIP_FAIL2BAN_SOURCE=0leaves fail2ban out as a source on a host where it is about to be removed. - Unwatched services (0.3.35 to 0.3.37).
doctornames a service that listens on a port or writes a log that no source watches, judges the log rather than the service name and ignores sockets bound to loopback only. - Admin ranges (0.3.41).
install --admin-ipkeeps a whole CIDR range in the auto whitelist instead of its first address.
Every update the agent installs on its own is checked against an Ed25519 signature (RFC 8032) over the published checksums and started once before it replaces the running binary. The variables of install.sh are listed on the install page, the migration path on replacing fail2ban.
Questions about Linux Agent 0.3.48
Do I have to change my config.yaml after updating?
An existing config.yaml keeps working without a change, and a host keeps the log level its file names. Two things change on their own: the volume alarm is on by default and raises a warning, plus one mail when notify.email is set, when a web log floods; volume_factor: 0 switches it off. And since 0.3.43 an override of a rule’s action alone, such as report: false, no longer puts the rule under a day of observation. One step is needed: a host installed with a CIDR range for --admin-ip before 0.3.41 holds only its first address and should add the range with whitelist add.
Does the volume alarm ban anything?
The volume alarm never bans and never reports. It raises the health state volume to warning, names the loudest site and points to reportedip-agent status for the full list. It clears after a full quiet hour. Banning a flood stays with the detection rules, for example web-query-crawl once you arm it.
Which plan do I need for the Linux Agent?
The agent runs on every plan, Free included: local detection, local bans and reports always work. The community feed needs a server licence: Professional includes one server, Business three, Enterprise by contract, and from Professional upwards further servers can be added per host. Details are on the licences page.
Read on
Running WordPress next to your servers? The Hive 2.1.72 release covers the WordPress side of the same groups. How tester licences work is explained in free tester licences for the Linux Agent.
Block what the community already saw and report what your own logs find, on every Linux server.