ReportedIP Hive 3.0.9 and Pro 3.1.0: a load shield against bot floods on WordPress
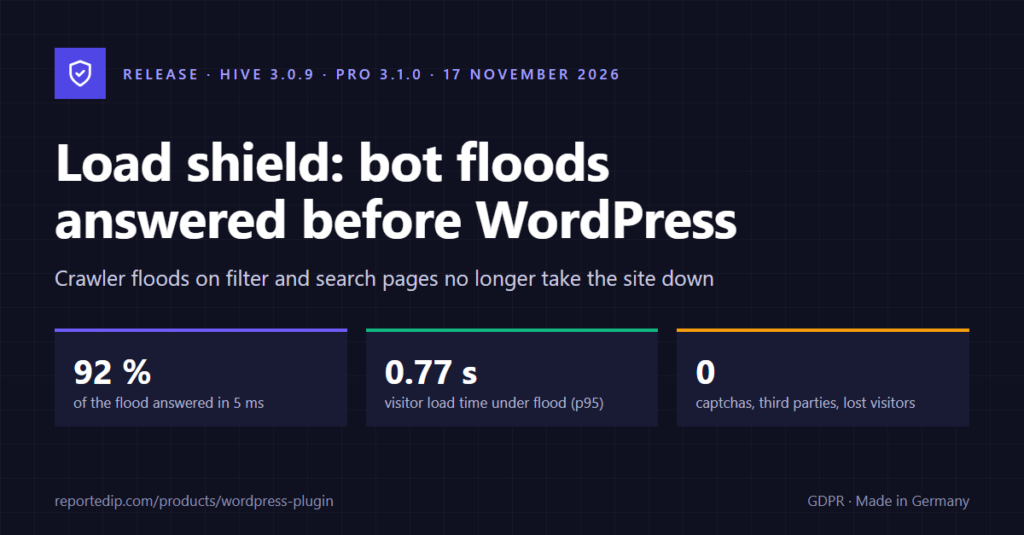
ReportedIP Hive 3.0.9 and the Pro add-on 3.1.0 introduce the load shield: it answers bot floods on uncached pages before WordPress loads. Both updates are out, the free plugin on wordpress.org and the Pro add-on on reportedip.com. In our load test, page load time for visitors during a flood fell from 28.5 to 0.77 seconds (95th percentile), and 92% of the flood was answered in about 5 milliseconds.
The load shield is switched off after the update. This article explains how it works, what your visitors see and how to set it up in six steps. You need the Pro plan or higher and Hive’s Extended Protection.
Key points at a glance
- What it does: The load shield counts expensive requests (filters, search, query strings) from clients without a cookie. When a minute is far above the learned normal level, it checks these clients before WordPress starts.
- What visitors notice: Usually nothing. A visitor who arrives for the first time during a flood is redirected once (under a second) or sees a browser check for about a second. There is no image puzzle and no third-party service.
- When it steps in: With the “Automatic” setting, only during a flood. On quiet days nobody is checked.
- Who is never checked: Logged-in users, verified search engines and other verified crawlers, the server itself, feeds and the WordPress endpoints.
- What it costs: At rest, 1 to 3 microseconds per request.
- What you need: Hive 3.0.9, Hive Pro 3.1.0, the Pro plan or higher, Extended Protection active.
Why is a page cache not enough against bot floods?
A page cache only helps with addresses that repeat. Filter pages, search results, calendar views and every address with a query string are almost always unique. Each of these requests starts WordPress, loads every plugin and queries the database. On a typical site that takes between half a second and several seconds and occupies a PHP worker for that long.
Crawlers that collect training data or scrape content follow exactly these links. A calendar with filters for month, category and location produces millions of possible addresses. When the requests come from hundreds of thousands of changing addresses, no per-IP block applies: each address sends only one or two requests and stays below every threshold.
The load shield was built because of exactly such a case. From 12 to 16 November 2026, an event website in our care received 1.26 million requests per day on its calendar filters, spread across 439,820 IP addresses. The server load rose to 47, and real visitors waited half a minute or got an error. This was not an attack in the classic sense, nobody was looking for a vulnerability. The site was saturated with expensive page views.
The background on such floods, and what you can do about them without a plugin, is in our guide Detecting and stopping bot floods.
How does the load shield detect a flood?
The load shield watches a single signal: expensive requests without any cookie. A request is expensive when it is a page view (GET or HEAD) with a query string that is not a pure tracking parameter, or when it hits a path that you list as expensive yourself. A browser that has been on the site before almost always brings a cookie. A crawler that works through a list of addresses brings none.
From these requests the load shield learns the normal level of your site as a moving average over many hours. The alarm triggers when a minute meets both conditions:
- at least 120 expensive requests without a cookie (the minimum flood size, adjustable from 30 to 5,000) and
- at least five times the normal level (adjustable from 2 to 50).
So a site with 7 such requests per minute switches on at 120, and a large site with 80 per minute only at 400. Counting also runs within the current minute: in the load test, the shield was up 37 seconds after the flood began.
The alarm ends after 15 minutes at the earliest, and only once the requests are back at a normal level. As long as clients with a cookie keep requesting at half the flood level, it stays on.
| State | What the load shield does | What visitors see |
|---|---|---|
| Quiet | Only counts, 1 to 3 microseconds per request | Nothing |
| Flood detected | Checks clients without the shield cookie on expensive pages | A single redirect or a short browser check |
| Flood with cookie holders | Requires the browser check from everyone | Browser check, about a second |
| Per-minute limit reached | Lets checked visitors through in stages | Waiting page, then checkbox page |
| Flood over | Switches off after 15 minutes and quiet minutes | Nothing |
What do visitors see during a flood?
Most visitors see nothing, because they already carry a cookie of the site or request a cached page. For everyone else there are four possible pages. All four work without third-party assets, load no font and no script from outside, respect dark mode and can be used with a keyboard and a screen reader.
Stage 1: the invisible redirect
A client that requests an expensive page without a cookie during a flood gets an empty interstitial page that immediately redirects to the same address and sets the cookie rip_human along the way. A browser follows the redirect, sends the cookie and receives the page. This takes about 5 milliseconds on the server and people do not perceive it. A crawler that does not store cookies lands on the interstitial page again and never reaches WordPress.
Stage 2: the browser check
Suspicious clients get a computational task instead of the redirect. A client is suspicious when it sends conspicuous headers, when it has failed the redirect three times, or when it is on the watch list. Every client counts as suspicious as soon as cookie holders also request at flood level. The browser solves the task (SHA-256, one second on average) in the background and then reloads the page by itself.
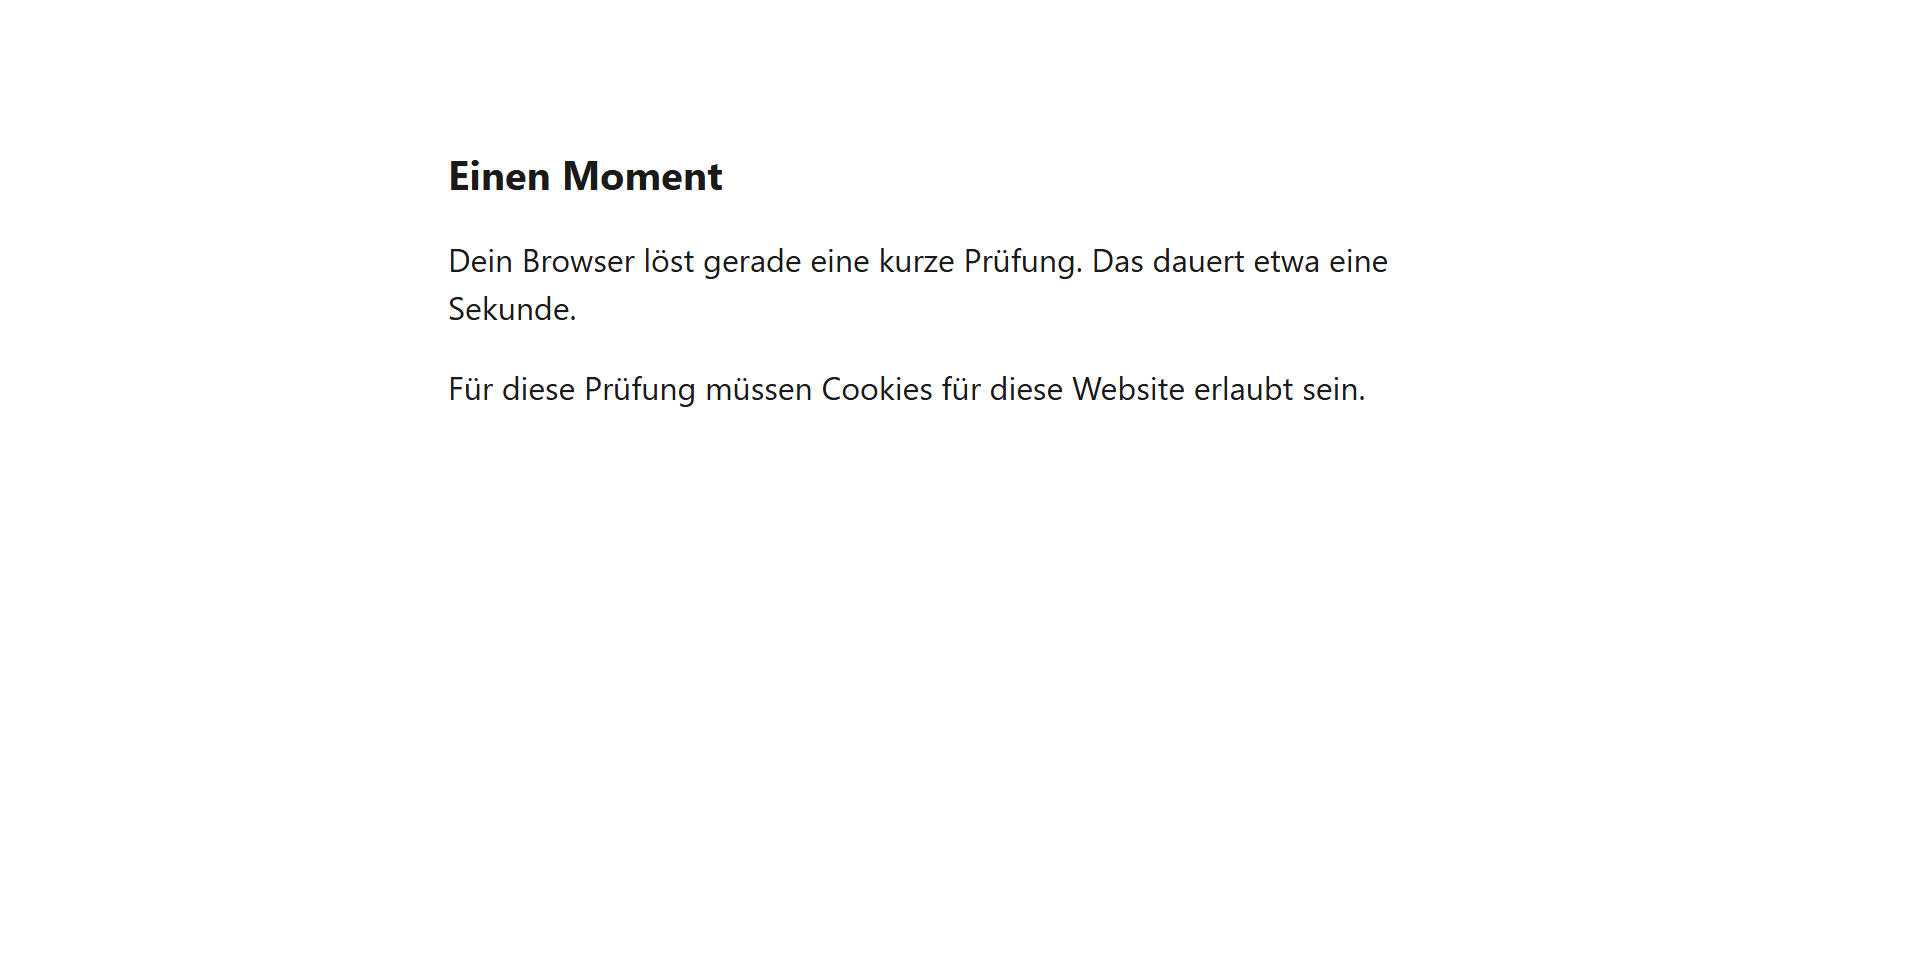
Without JavaScript the same page appears with a button. The visitor waits about five seconds and clicks “Continue”. A visitor who clicks too early gets the page again.
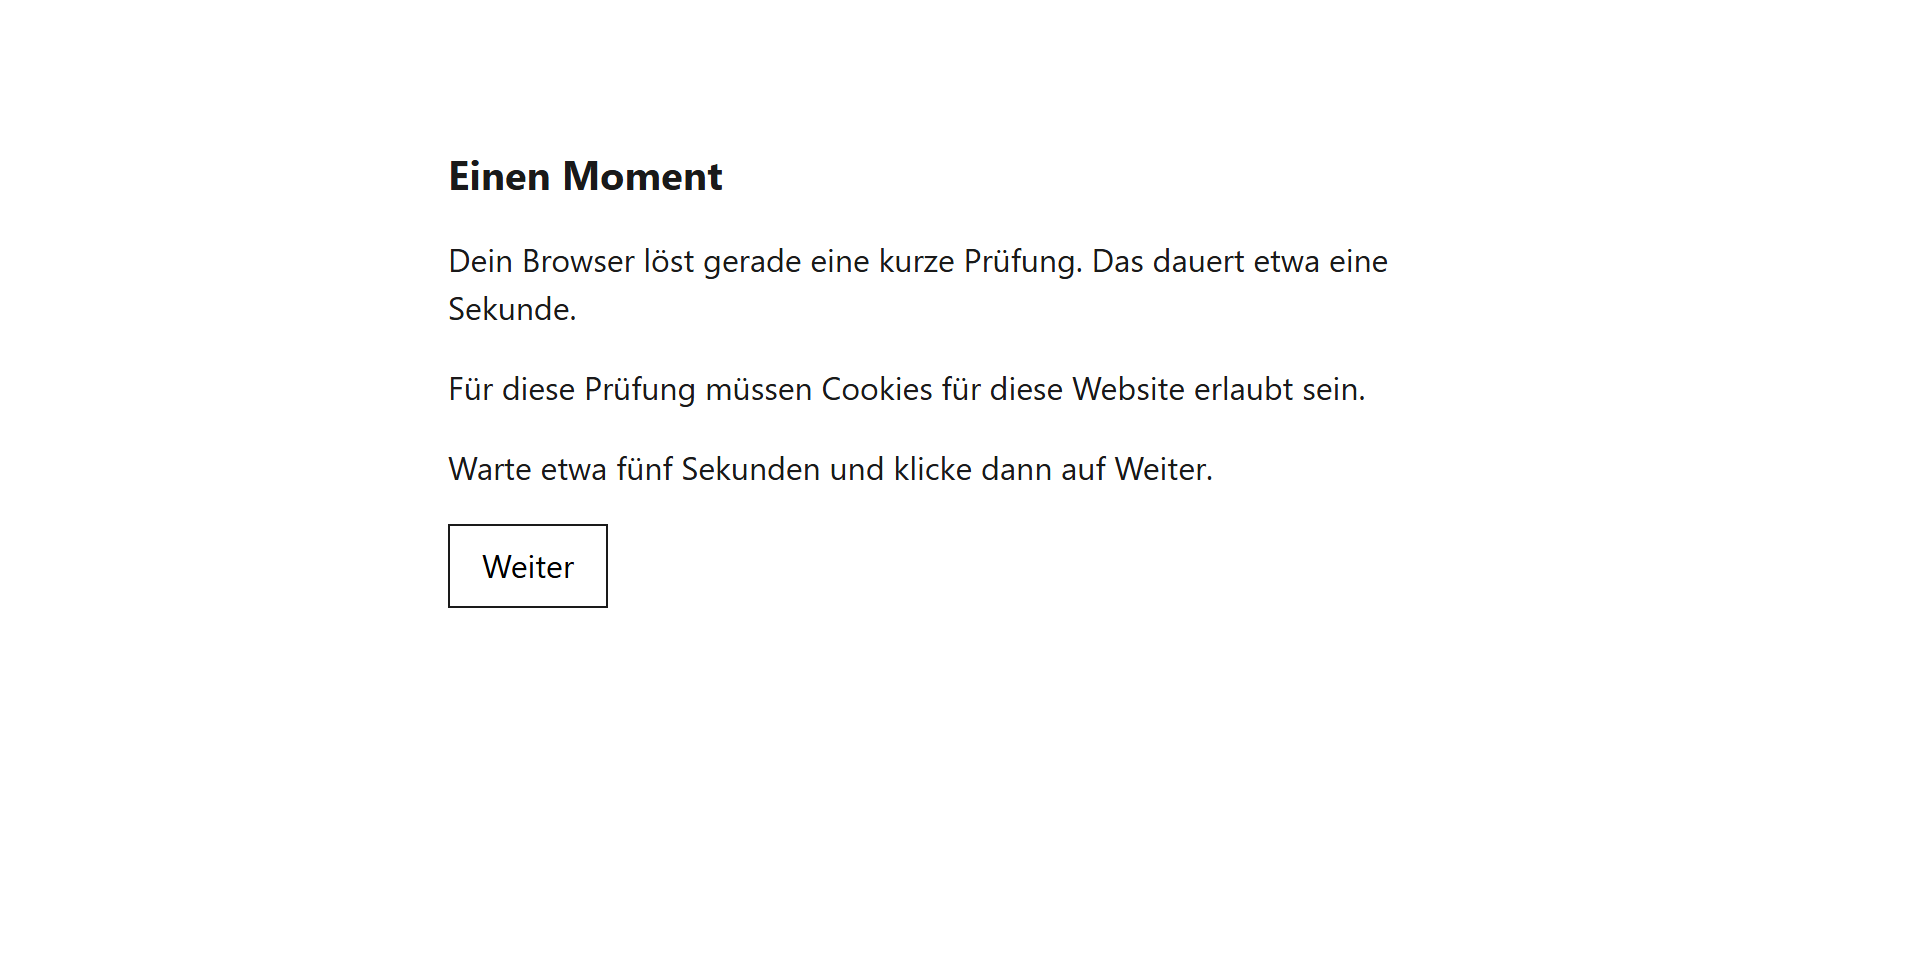
Over unencrypted HTTP, browsers do not provide the hash function this needs. There, the redirect from stage 1 does the checking.
The waiting page
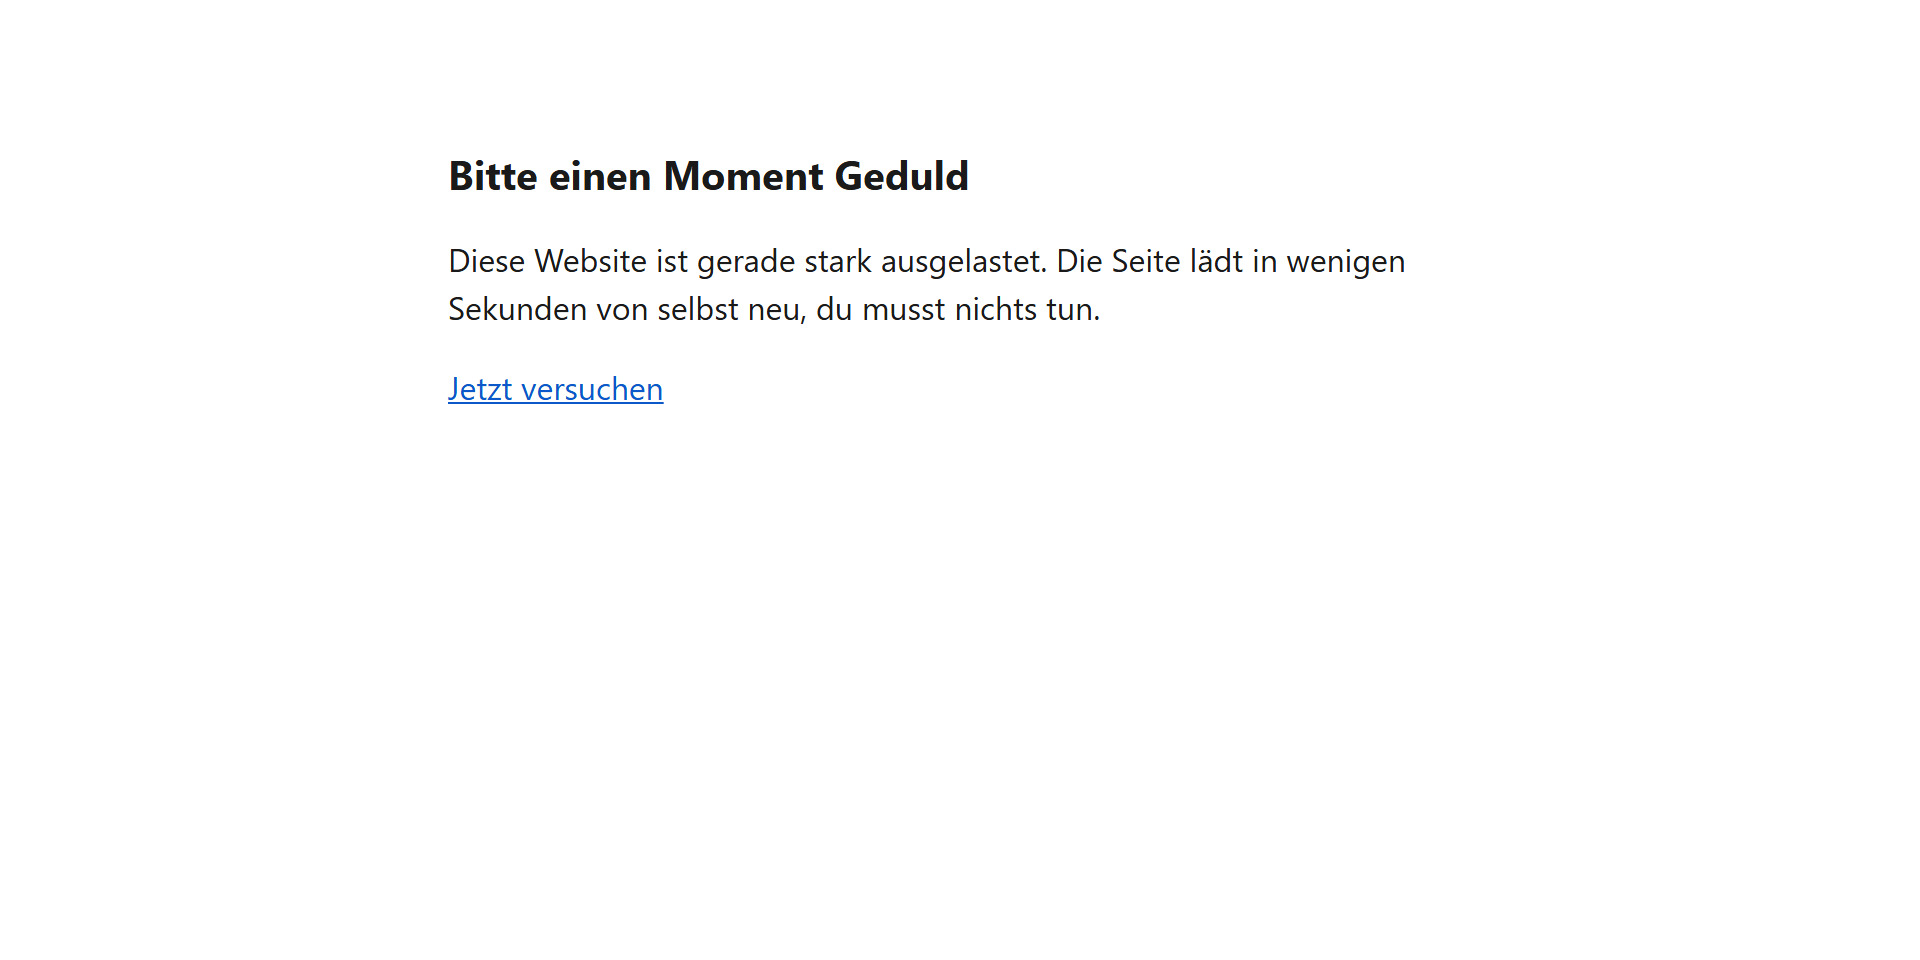
If a botnet with real browsers solves the task, it would still overload WordPress. The per-minute limit prevents that: during a flood, at most 120 new visitors per minute get through after a passed check (adjustable, 0 switches the limit off). Anyone above that sees the waiting page. It reloads by itself after a few seconds.
Visitors who have already been let through are not counted. Once you are on the site, you stay on the site.
The checkbox page
If the per-minute limit was full in one minute, new visitors in the following minute get a box to tick instead of the computational task. The box is a normal form field, not a third-party service, and works without JavaScript.
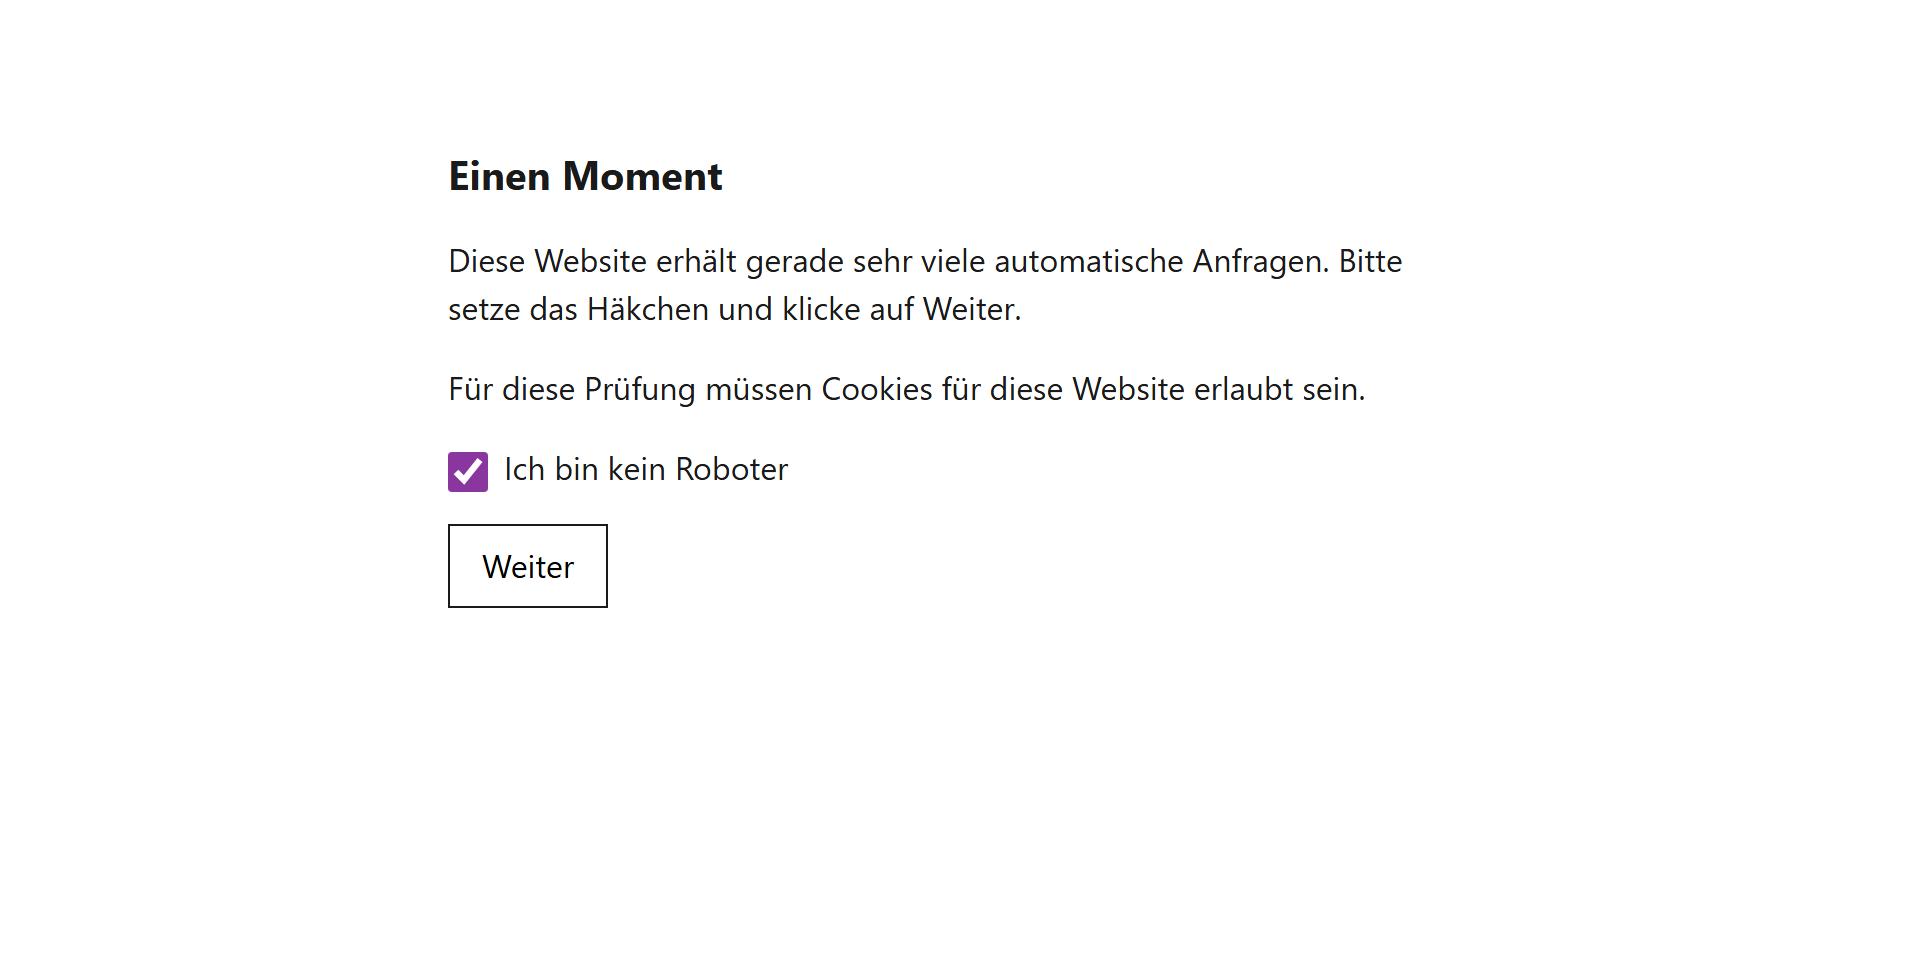
What search engines see
All check pages are delivered with status 503 and the Retry-After header, plus Cache-Control: no-store. Search engines treat that as temporary and come back, the page does not drop out of the index and the check page is not indexed. Verified crawlers never see the check anyway (see below).
How do I set up the load shield?
Setup takes about ten minutes, and the measuring phase in between takes a day. The screenshots show the English interface. The two tables in steps 4 and 5 also list the German labels.
Step 1: Update Hive and Hive Pro
Under Plugins, first update ReportedIP Hive to 3.0.9, then ReportedIP Hive Pro to 3.1.0. The load shield is part of the Pro, Business and Enterprise plans. Community & Key shows which plan belongs to your Community Access Key.
Step 2: Enable Extended Protection
The load shield runs inside Extended Protection. That is the part of Hive that PHP loads before WordPress. Only there can a request be answered in milliseconds without starting WordPress, the theme and the plugins.
- Open Server & Maintenance and go to the Server tab.
- Turn on the switch in the Extended Protection card. Hive adds the required line to the
.user.iniof your site. - Wait until the card reports “Active”. Depending on the server, PHP takes up to five minutes to re-read the
.user.ini.
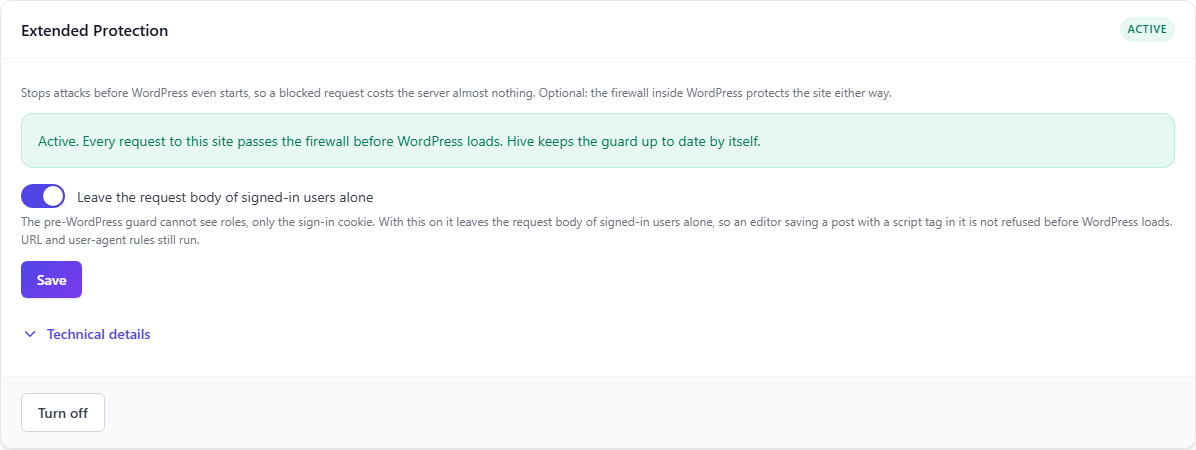
On servers without .user.ini (for example Apache with mod_php), the card names the one line that belongs in the server configuration. As long as Extended Protection is not running, the load shield does nothing and says so: the setting shows “Status: waiting for Extended Protection”, and the next steps on the dashboard include the entry “Set up Extended Protection for the load shield”.
Step 3: Measure only for one day
Open Protection Settings, go to the Firewall tab and set Load shield to Measure only. In this mode the load shield learns the normal level of your site and writes to the log when it would have switched on. Nobody is checked.
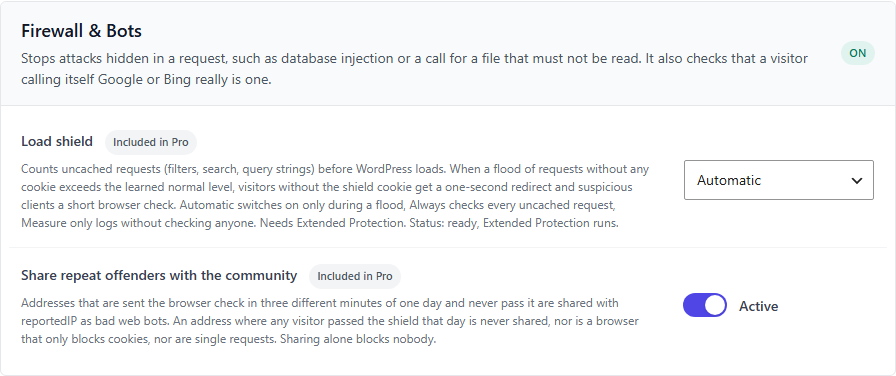
After a day, look under Activity, sub-tab Load shield. If there is no “Load Shield Would Switch On” entry, your normal traffic is safely below the threshold. If there is one at a time when you expected visitors (newsletter, campaign), raise the minimum flood size in step 5.
If your site is under a flood right now, you can skip the measuring phase and choose “Automatic” straight away.
Step 4: Switch to “Automatic”
Set the mode to Automatic and save. From now on the load shield switches itself on during a flood and off again afterwards.
| Mode | German interface | Effect | Use it for |
|---|---|---|---|
| Off | Aus | The load shield neither counts nor checks | Default after the update |
| Measure only | Nur messen | Learns the normal level, logs, checks nobody | The first days |
| Automatic | Automatisch | Checks only during a flood | Continuous operation, our recommendation |
| Always | Immer | Checks every expensive request without a cookie, even without a flood | Sites under constant fire |
Step 5: Review the fine tuning
The defaults fit most sites. The controls sit behind Show technical details.
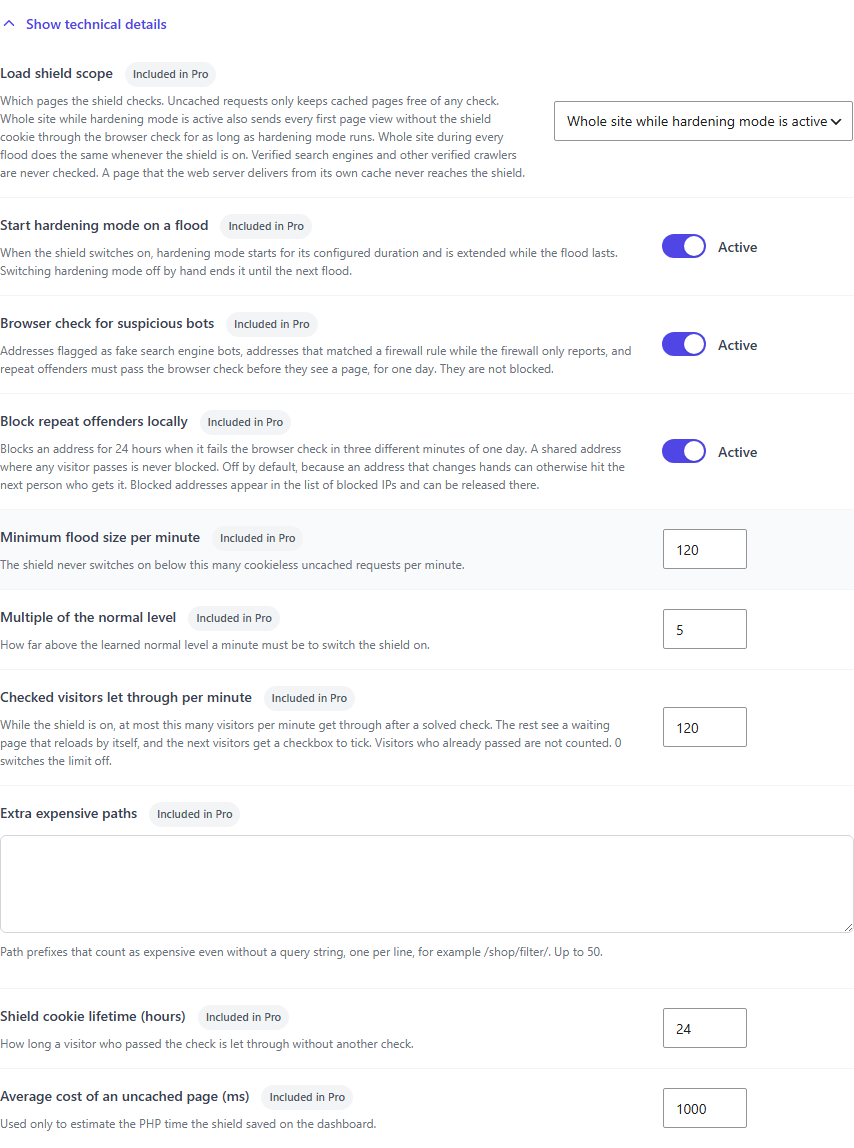
| Setting | German interface | Default | Meaning |
|---|---|---|---|
| Load shield scope | Umfang des Lastschutzes | Whole site while hardening mode is active | Which pages are checked: uncached requests only, additionally every first page view while hardening mode is active, or the whole site during every flood |
| Start hardening mode on a flood | Härtungsmodus bei einer Flut starten | On | A flood starts Hive’s hardening mode and extends it for as long as the flood lasts |
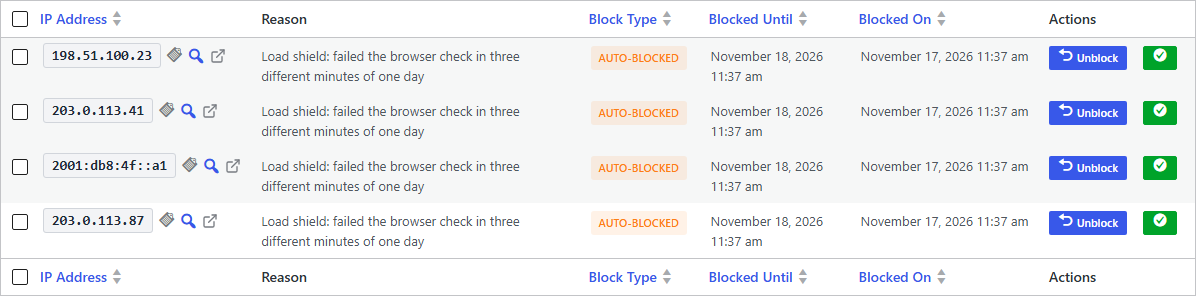
| Share repeat offenders with the community | Wiederholungstäter mit der Community teilen | On | Addresses that get the check in three different minutes on one day and never pass are reported to reportedIP as “Bad Web Bot” |
| Browser check for suspicious bots | Browser-Prüfung für verdächtige Bots | On | Fake search engine bots, firewall hits in Report Only mode and repeat offenders must pass the browser check on every page for one day. They are not blocked |
| Block repeat offenders locally | Wiederholungstäter lokal sperren | Off | Blocks repeat offenders for 24 hours through the normal block list |
| Minimum flood size per minute | Mindestgröße einer Flut pro Minute | 120 | Below this value the load shield never switches on (30 to 5,000) |
| Multiple of the normal level | Vielfaches des Normalwerts | 5 | How far above the normal level a minute must be (2 to 50) |
| Checked visitors let through per minute | Durchgelassene geprüfte Besucher pro Minute | 120 | Per-minute limit during a flood, 0 switches it off (up to 6,000) |
| Extra expensive paths | Zusätzliche teure Pfade | empty | Path prefixes that count as expensive even without a query string, one per line, 50 at most |
| Shield cookie lifetime (hours) | Laufzeit des Lastschutz-Cookies | 24 | How long a passed check stays valid (1 to 168 hours) |
| Average cost of an uncached page (ms) | Durchschnittliche Kosten einer ungecachten Seite | 1000 | Only used to estimate the saved server time on the dashboard |
Three notes from practice:
- Shops and campaigns: If a newsletter sends several hundred new visitors to filter pages within one minute, set the minimum size to twice the value of your busiest normal moment. These visitors would not notice the redirect, but there is no need for an alarm without a flood.
- Expensive pages without a query string: Enter paths such as
/shop/filter/or/events/if your theme writes filters into the path. - Local block: Leave it off at first. The browser check already keeps repeat offenders away from WordPress, and it cannot lock out a shared office address.
Step 6: Check the effect
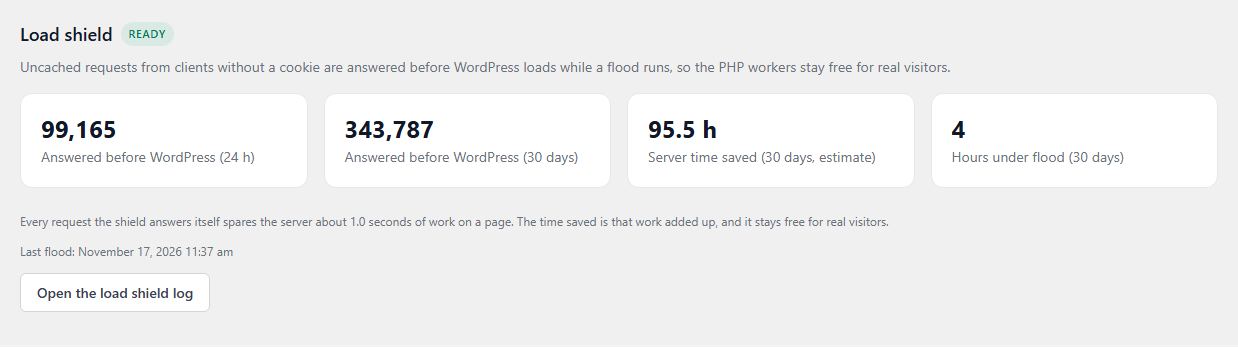
On the Dashboard, the Load shield card shows the state and four figures: requests answered before WordPress in 24 hours and in 30 days, the estimated server time saved and the hours under flood.
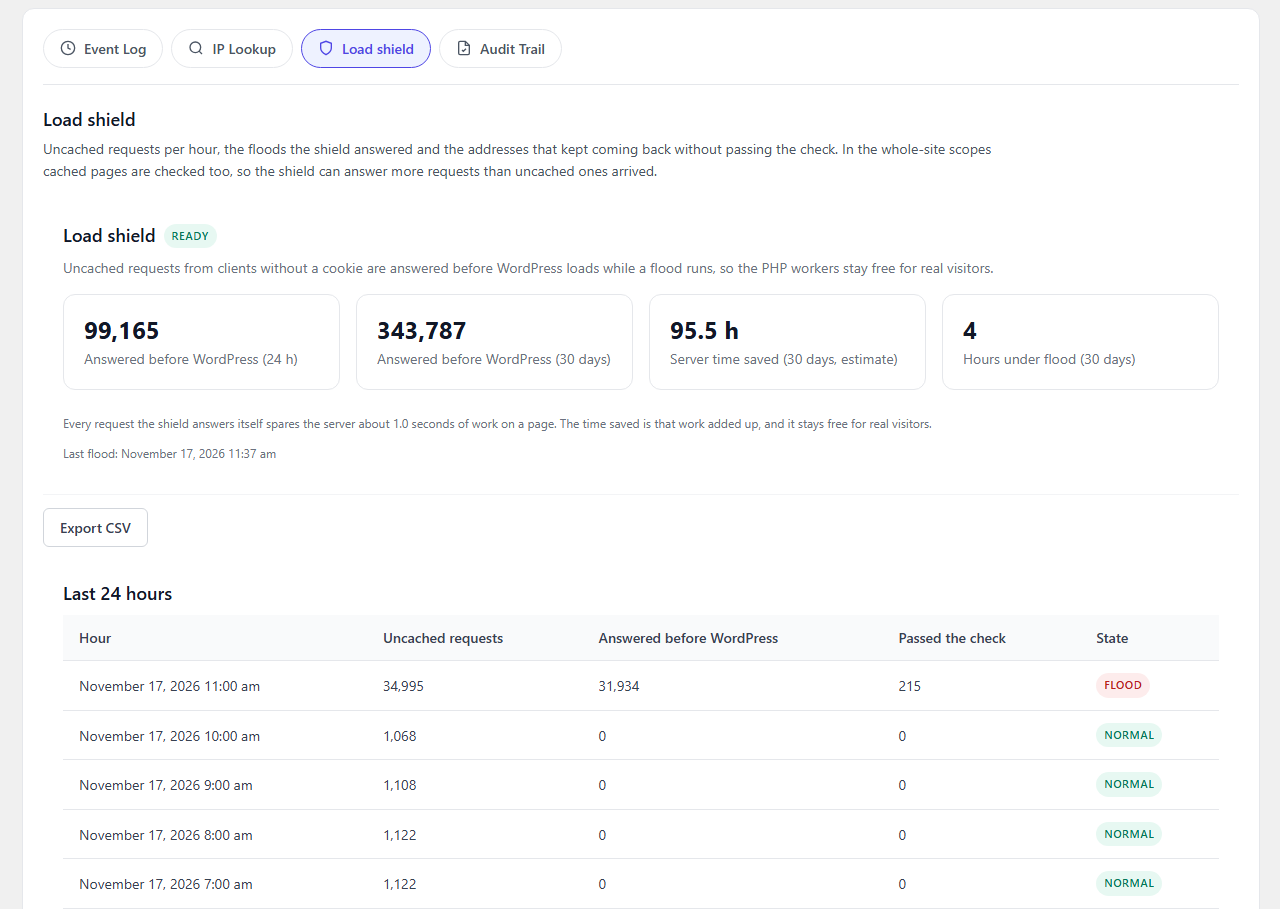
The Open the load shield log button leads to the Load shield sub-tab under Activity. It lists the last 24 hours as a table: uncached requests per hour, how many of them were answered before WordPress, passed checks and the state of the hour.
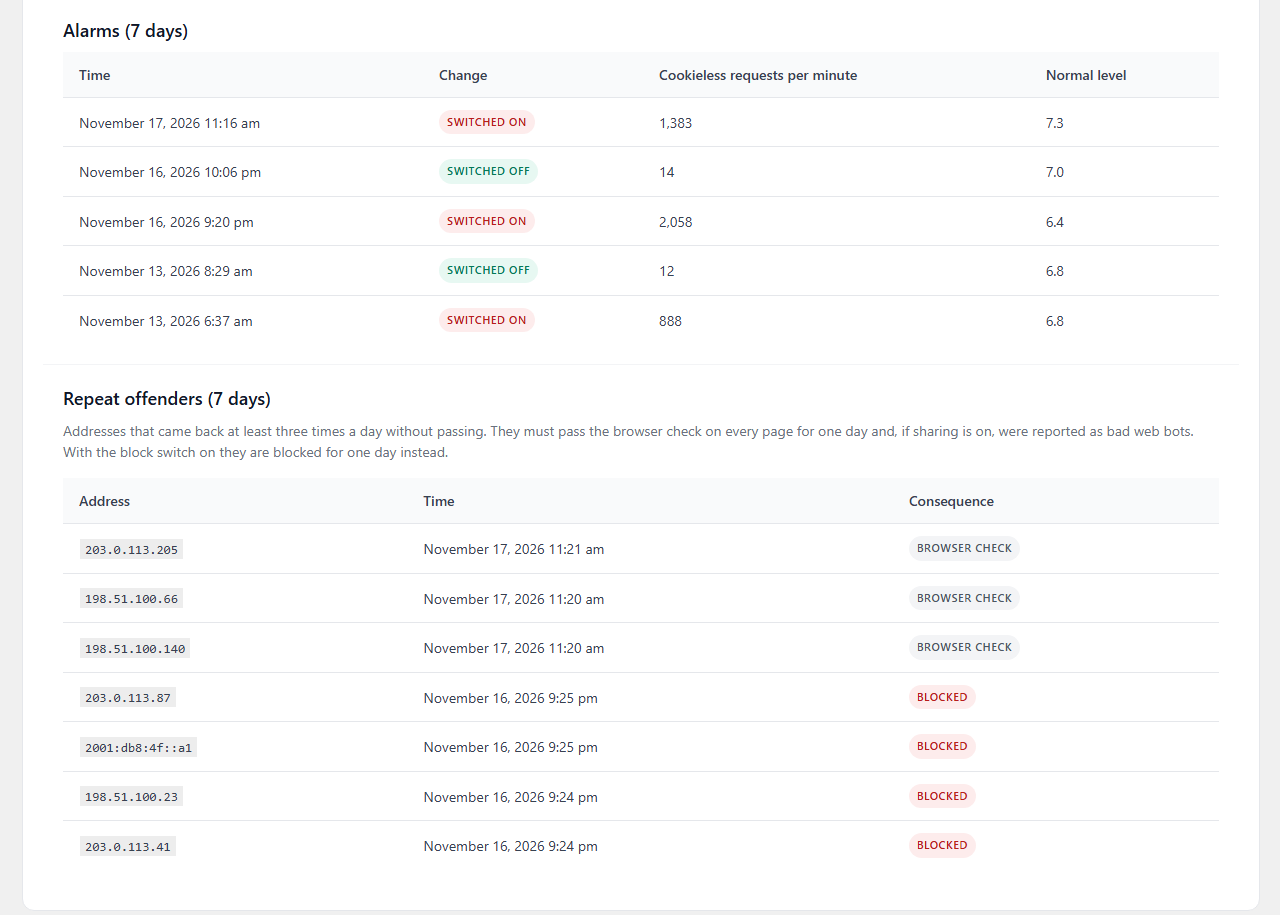
Below that come the alarms of the last seven days with the value that triggered them and the normal level at that time, followed by the repeat offenders and their consequence.
Export CSV downloads the per-minute values, samples and repeat offenders of the last 30 days. The load shield stores nothing for longer than that.
How do I find load shield events in the event log?
Every switch-on and switch-off is also recorded in the normal event log under Activity. The type filter knows whole groups: the Firewall group contains “Load Shield Switched On”, “Load Shield Switched Off” and “Load Shield Blocked Repeat Offender”, and the Bots group contains “Load Shield Repeat Offender”.
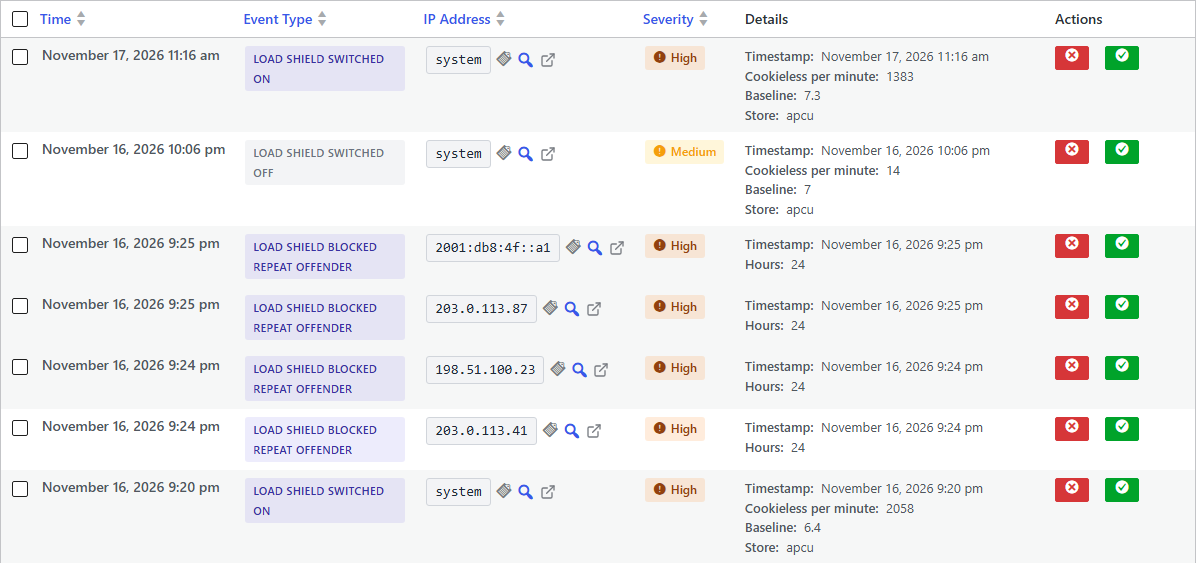
When the local block is switched on, blocked repeat offenders appear in the normal block list under Activity, IP Lists. There you release an address with one click. The whitelist applies as everywhere in Hive: an address on the whitelist is neither checked nor blocked.
How does the load shield prevent false alarms?
A protection that locks out real visitors is worse than none. That is why the load shield is built at every point so that the visitor gets through in case of doubt:
- Check instead of block. The consequence of a flood is a redirect or a computational task that every browser passes. Blocking only happens if you switch on the local block, and then only for addresses that were checked three times on one day and never passed.
- One passed check protects the whole address. If any visitor from an address has passed the check on a given day, that address never counts as a repeat offender. This protects offices, universities and mobile networks, where many people share one address.
- Cookie blockers are recognised. A browser that accepts no cookies gets the browser check after three redirects and is then free for 15 minutes. It is never reported.
- Logged-in users carry the WordPress cookie and never see a check.
- Verified crawlers are identified by reverse DNS with forward confirmation and are never checked. Until the crawler list has loaded on a freshly set up site, the load shield only measures.
- Technical access stays free: the server itself, private addresses, trusted proxies without a client header, WordPress endpoints (cron, REST, AJAX, login, also in a subdirectory), feeds,
wc-apiand iCal requests. Firewall exceptions that you have set for the whole firewall apply here too. - If something fails, the site stays reachable. If Extended Protection cannot read or write its counter, it lets the request through.
- In measuring mode nothing is ever blocked and nobody is ever checked.
What happens to search engines and AI crawlers?
Crawlers that identify themselves and whose origin can be verified never see the load shield. To do this, Hive looks up the hostname of the requesting address and resolves it back again as confirmation. A client that merely calls itself “Googlebot” in the user agent does not pass this test and ends up on the watch list.
In live operation on the affected site, Googlebot, Applebot, PerplexityBot and SeznamBot, among others, got through with status 200 during the alarm. Crawlers that cannot be verified got the check with status 503 and Retry-After, like any other client without a cookie. That is the response HTTP provides for “overloaded right now, please come back later”, and reputable crawlers respect it.
What does the load shield achieve in numbers?
We measured the load shield in three ways: in a load test against a copy of the affected site, in a replay of eleven days of real access logs and in live operation.
Load test: flood plus real visitors
| Metric | Without load shield | With load shield (Automatic) |
|---|---|---|
| Page load time for visitors, 95th percentile | 28.5 s | 0.77 s |
| Successful visitor page views | 8 of 180 | all |
| WordPress executions | 5,132 | 697 |
| CPU usage | 681% | 20.7% |
| Share of the flood answered in about 5 ms | 0% | 92.1% |
| Time until the alarm | not applicable | 37 s |
Replay of eleven days of access logs
Eleven days with 3.0 million requests in total, including the five flood days and five quiet days:
- The share of crawler requests that reached WordPress fell from 15.1% to 4.2%.
- The peak fell from 2,167 to 306 uncached pages per minute.
- All 36,711 page views by real visitors were delivered, not a single one was lost.
- On the five quiet days the load shield raised no alarm.
Live operation
Ten minutes of live operation during the flood:
- 1,342 addresses got the check, 60 of them solved it and saw the page.
- Of the addresses that did not solve it, not a single one ever loaded an image, a stylesheet or a script. So these were not real browsers.
- 1,268 of these addresses targeted calendar filters, only 20 targeted pages without a query string.
- The server load was 1.5 to 2.4 instead of 47.
- A fresh browser needed 3.7 seconds (desktop) and 0.6 seconds (mobile) to the finished page, including the check.
What are the limits?
- Bots with real browsers store cookies and solve the computational task. The per-minute limit, the waiting page and the checkbox page work against them: they limit how many new clients reach WordPress per minute. They cannot stop such a botnet completely.
- The load shield does not replace a page cache. It protects the pages that cannot be cached. A page that the web server delivers from its own cache never reaches PHP and is neither counted nor checked.
- Changing networks triggers the redirect again. The cookie is bound to the visitor’s network (/24 for IPv4, /64 for IPv6). A visitor who switches from Wi-Fi to the mobile network is redirected once more during a flood.
- No load shield without Extended Protection. On hosting packages that allow neither
.user.ininor a custom PHP setting, it cannot be operated. - Bandwidth attacks at the network level are the hosting provider’s job. The load shield protects the PHP workers, not the line.
Is the load shield GDPR compliant?
The load shield runs entirely on your server. No third-party service is included, no captcha provider, no font and no script from outside.
- Cookie:
rip_humancontains a timestamp and a signature that is bound to the visitor’s network. It contains no identifier that could be used to recognise a visitor or to track one across pages. It is only set during a flood, is valid for 24 hours and isHttpOnlyandSameSite=Lax. Its only purpose is to protect the site from overload. Please clarify with your data protection officer whether you classify it as technically necessary and mention it in your privacy policy. - Log: The load shield stores per-minute counters and, for repeat offenders and samples, the IP address. Everything is deleted after 30 days.
- Community report: When sharing is switched on, the address of a repeat offender goes to reportedIP with the category “Bad Web Bot”. Single requests, cookie blockers and addresses from which someone passed on that day are never reported. The switch can be turned off.
- Uninstall: With the option to delete data, Hive Pro removes the tables and files of the load shield.
How do I control the load shield with WP-CLI and MainWP?
Hive 3.0.9 adds three new WP-CLI commands for all settings. They use the same validation as the admin interface, and an invalid value is rejected.
wp reportedip settings list
wp reportedip settings get reportedip_hive_load_shield_mode
wp reportedip settings set reportedip_hive_load_shield_mode log
wp reportedip settings set reportedip_hive_load_shield_mode auto
wp reportedip settings set reportedip_hive_load_shield_floor 200
The values of the mode are off, log (Measure only), auto and always, those of the scope are expensive, hardening and all.
If you manage several sites, you see the state in the MainWP extension “ReportedIP Hive for MainWP”: a dedicated column shows per site whether the load shield is ready, measuring, waiting or answering a flood right now, and how many requests it has answered in 24 hours. The load shield settings follow Hive’s settings standard and can be distributed like all others through MainWP and the fleet management in the customer portal.
What else changes in Hive 3.0.9 and Pro 3.1.0?
- Stricter rule in hardening mode (Pro): If at least five addresses from the same /24 network have failed at the login within the last hour, the next IPv4 address from that network is blocked on its first failed attempt and shared with the community. The whitelist applies, IPv6 is exempt.
- “Pro” instead of “Professional”: The plan badge, plan labels and readme now name the plan the same way the pricing page does.
- Links in your language: Links from the plugin to reportedip.com lead to the German, French or Spanish version, otherwise to the English one.
- Export without a cap: The export of the event log (CSV and JSON) is no longer limited to 1,000 rows and applies the filters of the table.
- Multisite: Extended Protection always uses the directory of the main site.
- Safe writing: The Extended Protection file is replaced atomically (written to a temporary file first, then renamed). A half-written file can no longer occur.
- For developers: new hooks that let add-ons attach their own modules to Extended Protection (
reportedip_hive_guard_modules,reportedip_hive_guard_rebake,reportedip_hive_guard_queue_entry).
Frequently asked questions
Is the load shield a captcha?
No. Normally the visitor sees nothing at all, or a notice for one second. There are no images, no puzzles and no third-party service. Only when the per-minute limit is reached during a flood does a single checkbox appear, which the site delivers itself.
Does the load shield hurt my ranking?
No. Verified search engines are never checked. During a flood, all other clients receive status 503 with Retry-After, which search engines treat as temporary. Without a flood, the “Automatic” setting checks nobody.
What does the load shield cost in performance?
At rest, 1 to 3 microseconds per request. During a flood it saves resources: a check page costs about 5 milliseconds instead of a full WordPress execution.
Does the load shield work with WP Rocket, LiteSpeed Cache and other cache plugins?
Yes. Cached pages that the web server delivers directly do not reach the load shield. It takes care of whatever bypasses the cache. The check pages carry Cache-Control: no-store and end up in no cache.
Does the load shield work behind Cloudflare or another proxy?
Yes, provided the proxy is entered as trusted in Hive, so that the real visitor address is read. Requests from a trusted proxy without a client header are never checked.
Do I need APCu?
No. The load shield works with and without APCu.
What happens to visitors who block cookies?
They get the browser check after three redirects and are then free for 15 minutes. They are neither reported nor blocked.
Can I lock myself out as an administrator?
No. Logged-in users are never checked, and the login page, the REST API and admin-ajax.php are exempt.
How do I switch the load shield off in an emergency?
Set the mode to “Off” or run wp reportedip settings set reportedip_hive_load_shield_mode off.
Is the load shield also available in the free plugin?
No. The load shield belongs to the Pro add-on, from the Pro plan upwards. The free plugin still includes the firewall, login protection, 2FA and Extended Protection. The plans are listed on the pricing page.
Further reading
- Detecting and stopping bot floods
- ReportedIP Hive 3.0.7: spam protection for Divi contact forms
- ReportedIP Hive 3.0.5: security header check
- Documentation: Hive Pro
- Documentation: Installation
- Full changelog
Changelog
ReportedIP Hive Pro 3.1.0 (17 November 2026)
- New: load shield in Extended Protection with the modes Off, Measure only, Automatic and Always (Pro plan and higher).
- New: redirect for visitors without a cookie, browser check for suspicious clients, “Continue” after about five seconds without JavaScript.
- New: per-minute limit with waiting page and checkbox page, default 120 checked visitors per minute.
- New: load shield scope and link to hardening mode.
- New: watch list for fake bots, firewall hits in Report Only mode and repeat offenders (one day of browser checks instead of a block).
- New: share repeat offenders with the community as “Bad Web Bot” (default on), local block for 24 hours (default off).
- New: log tab, dashboard card, notice in the admin bar, CSV export covering 30 days, column in the MainWP extension.
- New: check pages with status 503 and
Retry-After, crawler verification by reverse DNS with forward confirmation. - New: /24 rule in hardening mode for failed logins.
- Changed: plan cards, upgrade notices and feature descriptions in the words of the pricing page.
- Uninstalling with data deletion removes the tables and files of the load shield.
ReportedIP Hive 3.0.9 (17 November 2026)
- New: WP-CLI commands
wp reportedip settings list,getandset. - New: hooks for add-on modules in Extended Protection, guard version 11. Sites rebuild Extended Protection by themselves after the update.
- New: log line “Report Sent” in the event log as soon as a report has gone to the community.
- Changed: “Pro” instead of “Professional” in the plan badge, plan labels and readme.
- Changed: links to reportedip.com in the language of the admin area (German, French, Spanish, otherwise English).
- Fixed: log export without the 1,000-row cap and with the filters of the table.
- Fixed: multisite always uses the directory of the main site for Extended Protection.
- Fixed: the Extended Protection file is written atomically.
Protect your WordPress site with a firewall, login protection, 2FA and the load shield against bot floods. The base plugin is free in the WordPress plugin directory.